The charts that matter: the US dollar flexes its muscles
The US dollar continued to strengthen this week. Here’s how the charts that reflect what matters most to the global economy reacted.

Welcome back.
In this week’s magazine we take a quick look at the effects of the Suez Canal blockage on world trade. We also look at private equity –Max King picks some of the best investment trusts to buy, while Frederic Guirinec says you should also consider some of the listed fund managers too.
As promised last week, we’ve got a new video for you. Merryn talks to author, analyst and former presidential adviser Pippa Malmgren on a whole range of topics, including NFTs, the digital fad of the moment the global recovery from the Covid-19 pandemic and about Donald Trump’s bid to create a media empire in his own image, which she predicts will look something like “Game of Thrones – but with more nudity”. Watch the video here. It’s also available as a podcast for those who prefer that format –listen here, or wherever you normally get your podcasts.
Subscribe to MoneyWeek
Subscribe to MoneyWeek today and get your first six magazine issues absolutely FREE

Sign up to Money Morning
Don't miss the latest investment and personal finances news, market analysis, plus money-saving tips with our free twice-daily newsletter
Don't miss the latest investment and personal finances news, market analysis, plus money-saving tips with our free twice-daily newsletter
And this week’s “Too Embarrassed To Ask” video explains what a “margin call” is –something that’s brought the huge family office called Archegos Capital Management to its knees. You can watch the video here.
Here are the links for this week’s editions of Money Morning and other web stories you may have missed.
- Monday: A big fund just blew up, rattling markets. What does that mean for your money?
- Merryn’s Blog: Young investors could bet on NFTs over traditional investments
- Tuesday: Why you should ignore the pessimists and invest now
- Tuesday web article: What does Joe Biden’s $3trn infrastructure plan mean for your money?
- Wednesday: Why is gold having such a miserable time and when will it turn around?
- Wednesday web article: Deliveroo has hit the market – but it’s not getting the warmest welcome
- Thursday: Why was Deliveroo’s IPO such a disaster? And what should investors do now?
- Thursday web article: The return of the 95% mortgage – what’s available and how much they cost
- Friday: Is bitcoin going mainstream, and should you buy in?
Now for the charts of the week.
The charts that matter
Gold fell further, but then started to make up a bit of ground towards the end of the week. Don’t get too excited, says Dominic Frisby, who reckons it might not bottom out until June.
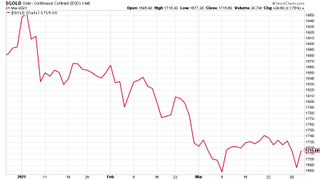
(Gold: three months)
The US dollar index (DXY – a measure of the strength of the dollar against a basket of the currencies of its major trading partners) continued its climb higher, with a little dip towards the end of the week.
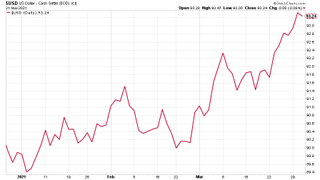
(DXY: three months)
Dollar strength showed itself against the Chinese yuan (or renminbi) –when the red line is rising, the dollar is strengthening while the yuan is weakening.
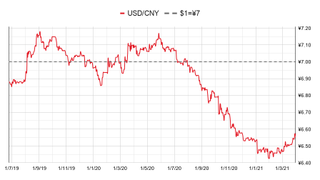
(Chinese yuan to the US dollar: since 25 Jun 2019)
The yield on the ten-year US government bond took a pause for breath towards the end of last week, but the trend remains higher.
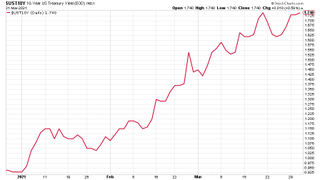
(Ten-year US Treasury yield: three months)
The yield on the Japanese ten-year bond perked back up significantly.
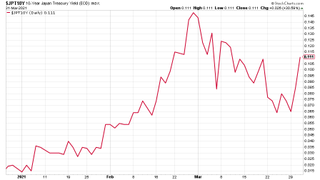
(Ten-year Japanese government bond yield: three months)
And the yield on the ten-year German Bund bounced back too, although it’s still in negative territory.
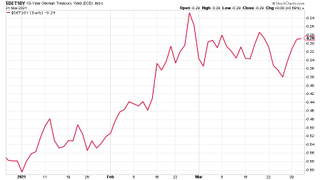
(Ten-year Bund yield: three months)
Copper’s drop accelerated somewhat.
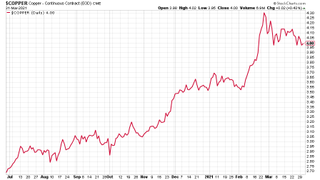
(Copper: nine months)
And the closely-related Aussie dollar attempted to rebound from its three-month low, but remains in the doldrums.
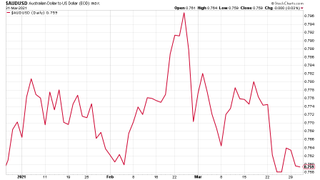
(Aussie dollar vs US dollar exchange rate: three months)
Cryptocurrency bitcoin clawed back most of its recent losses to head on higher.
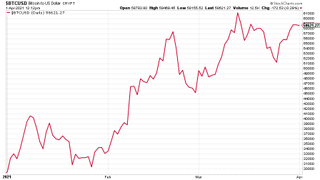
(Bitcoin: three months)
US weekly initial jobless claims rose by 61,000 to 719,000, compared to 658,000 last week (revised down from 684,000). The four-week moving average fell to 719,000, down 10,500 from 729,500 (which was revised down from 736,000) the week before. It’s the lowest level since March 2020, when it was just 225,500.
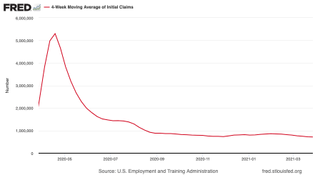
(US initial jobless claims, four-week moving average: since Jan 2020)
The oil price seems to be picking up a little, but remains quite volatile, torn between ongoing production caution on the behalf of Opec+, and concerns about European lockdowns delaying the global recovery further.
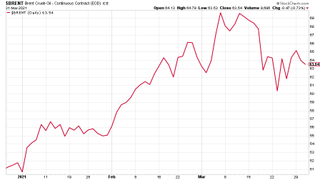
(Brent crude oil: three months)
Amazon seems to have steadied and is trading in a range.
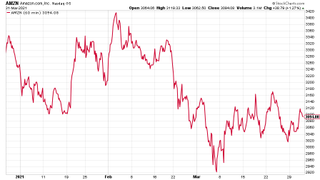
(Amazon: three months)
And Tesla has come back from its recent dip, perhaps encouraged by Joe Biden’s infrastructure spending spree, of which electric vehicles should be at least one beneficiary.
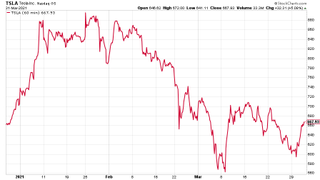
(Tesla: three months)
Have a great weekend.
Ben studied modern languages at London University's Queen Mary College. After dabbling unhappily in local government finance for a while, he went to work for The Scotsman newspaper in Edinburgh. The launch of the paper's website, scotsman.com, in the early years of the dotcom craze, saw Ben move online to manage the Business and Motors channels before becoming deputy editor with responsibility for all aspects of online production for The Scotsman, Scotland on Sunday and the Edinburgh Evening News websites, along with the papers' Edinburgh Festivals website.
Ben joined MoneyWeek as website editor in 2008, just as the Great Financial Crisis was brewing. He has written extensively for the website and magazine, with a particular emphasis on alternative finance and fintech, including blockchain and bitcoin. As an early adopter of bitcoin, Ben bought when the price was under $200, but went on to spend it all on foolish fripperies.
-
 UK sold house prices fall again amid mortgage rates uncertainty, ONS House Price Index shows
News The latest Office for National Statistics (ONS) analysis of UK sold house prices data showed they remained down year-on-year.
By Henry Sandercock Published
-
 UK inflation slowed again in March – but a rate cut could be some months away
The latest Consumer Price Index (CPI) data came in at 3.2% for March. This was slightly higher than some economists expected, but takes us closer to the Bank of England’s 2% inflation target.
By Katie Williams Published
-
 UK wages grow at a record pace
The latest UK wages data will add pressure on the BoE to push interest rates even higher.
By Nicole García Mérida Published
-
 Trapped in a time of zombie government
It’s not just companies that are eking out an existence, says Max King. The state is in the twilight zone too.
By Max King Published
-
 America is in deep denial over debt
The downgrade in America’s credit rating was much criticised by the US government, says Alex Rankine. But was it a long time coming?
By Alex Rankine Published
-
 UK economy avoids stagnation with surprise growth
Gross domestic product increased by 0.2% in the second quarter and by 0.5% in June
By Pedro Gonçalves Published
-
 Bank of England raises interest rates to 5.25%
The Bank has hiked rates from 5% to 5.25%, marking the 14th increase in a row. We explain what it means for savers and homeowners - and whether more rate rises are on the horizon
By Ruth Emery Published
-
 UK wage growth hits a record high
Stubborn inflation fuels wage growth, hitting a 20-year record high. But unemployment jumps
By Vaishali Varu Published
-
 UK inflation remains at 8.7% ‒ what it means for your money
Inflation was unmoved at 8.7% in the 12 months to May. What does this ‘sticky’ rate of inflation mean for your money?
By John Fitzsimons Published
-
 VICE bankruptcy: how did it happen?
Was the VICE bankruptcy inevitable? We look into how the once multibillion-dollar came crashing down.
By Jane Lewis Published